Help & FAQs
BedSect V3
What is BedSect?
BedSect is a web server tool to overlap multiple genomic regions datasets either uploaded or selected from the GTRD database to perform functional annotation of the unique as well as intersecting genomic regions using GREAT and UCSC. The integrated ShinyApp can be used to generate publication ready figures.
Citation
Mishra GP, Ghosh A, Jha A, Raghav SK.
Bedsect: An integrated web server application to perform intersection, visualization and functional annotation of genomic regions
from multiple datasets.
Frontiers in Genetics. 2020 February 05. doi:10.3389/fgene.2020.00003.
Does BedSect has a stand-alone version?
No, the tool is only available as a web server utility, but we are working on a stand-alone version.
Input file type and limits
The BedSect only supports genomic region files with BED (browser extention format) and formatting as input. The upload limit per file is 2 Megabyte. For functional annotation select the appropriate genome version beforehand. Each session data will be stored for 30 days from the date of analysis.
Input File Structure
chr1  213941196  213942363
chr1  213942363  213943530
chr1  213943530  213944697
chr2  158364697  158365864
chr2  158365864  158367031
First column will contain the standard chromosome name, 2nd column will have start position and 3rd column will contain the end position. Strand details is not necessary for the analysis. With each run of the analysis the server will generate a unique Session id which can be used for future access of the results. On the last date of each month the reports and the analysis details will be cleared to save storage space. So we recommend you to keep a backup of input files for future analysis.
* Do not include any file header.Ref: Ensembl.org
Tool Details
Homepage
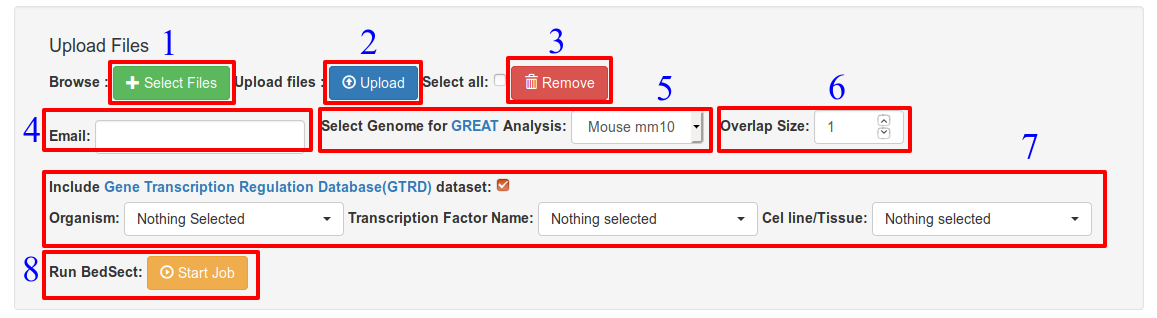 Options: (Ref: Fig. 1)
Result page
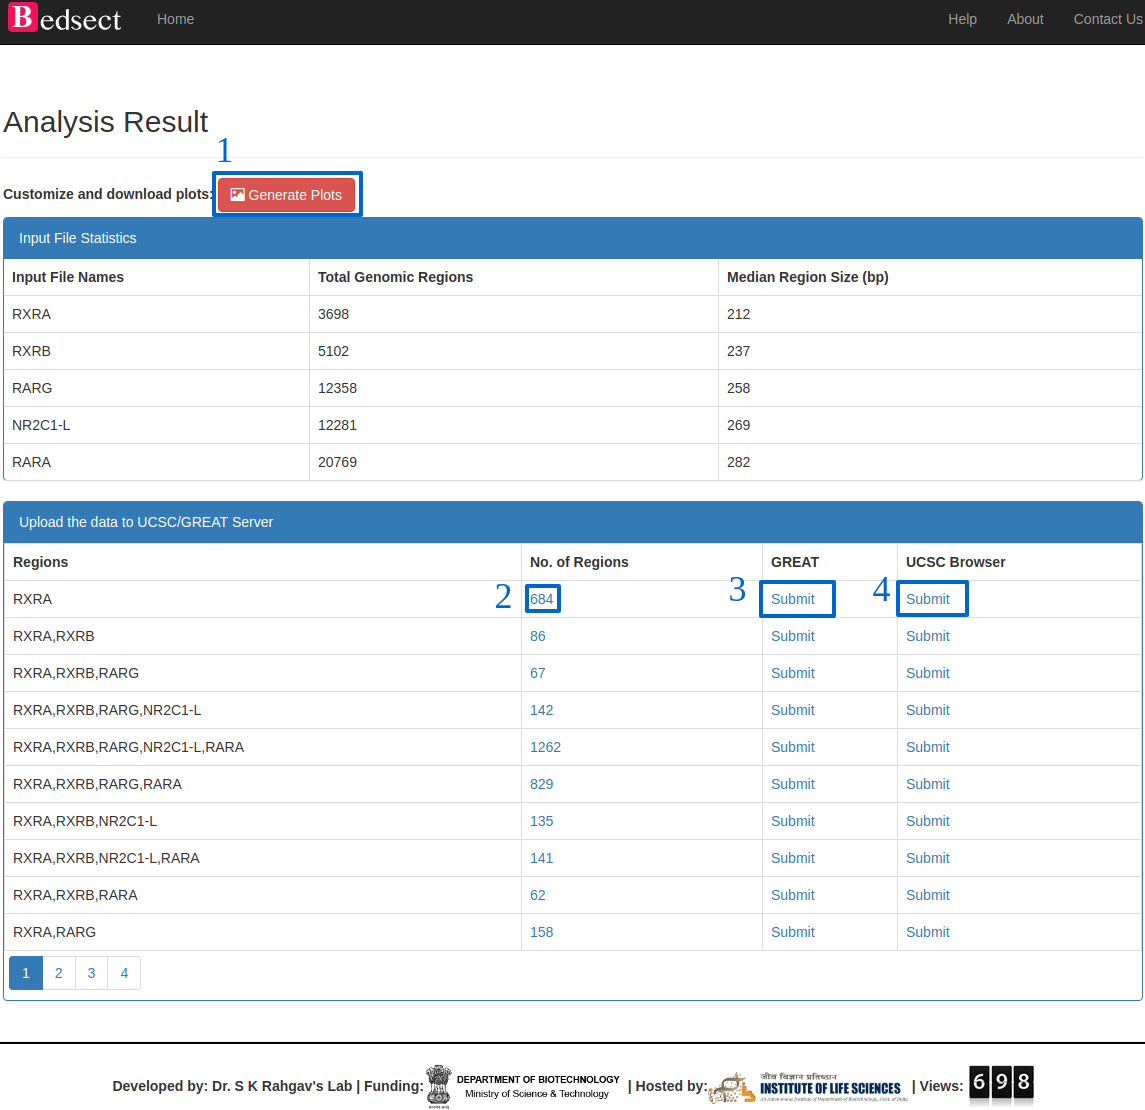 Details of the result page.(Ref: Fig. 2)